So, back on Sep 1, 2017 I was at work taking a short break and wanted to know if anyone had created art within Tableau. After a quick search on Twitter, I stumbled across Andy Cotgreave’s post about the Kraken…!? Absolutely stunned; I wanted to know more about how to create this right away!
I remembered using a tool at my current position called the Drawing Tool, brought to you by Interworks, and we used it to map out the “hot-zones” within the distribution center and warehouse. By taking a top down view of any warehouse layout, you can visualize where these spots are so you can rearrange the “bin” layouts to create a more efficient warehouse operation. I thought, “Since this tool can map out our warehouse, can I create ‘simple’ art with it?” and then, I was intrigued.
That’s when I realized that art is possible in Tableau! After searching on Google for a couple of minutes I came across the picture below. I thought that it was a cool pic and it represented Fio and I very well and it would be a fairly simple picture to try and replicate.

Once I found the subject that was going to be re-created within Tableau it was time to get the tools operational! First you have to go to the following web-address:  Then all you have to do is fill out their form to access the awesome tool!!

After this is filled out, you can start creating polygon art within Tableau! As soon as you start the online program a help menu will appear…this menu is very helpful in the beginning! Do check it out!
…Now, time to map out the (x,y) coordinates! You want to make sure that the settings are for an ‘Image’ and the Drawing Options is set on ‘Polygons’. This way you can create a path, x, y, and object ID field.

 Time to Draw! After loading the photo into Interwork’s Drawing Tool the first thing to do is select your first ‘node’. From here you can start outlining the art you want to create!
  After sectioning off one specific color of the subject, we can see that it is one connected polygon! Now, let’s see more…!
And more…!

After a few minutes we can easily outline all of the polygons within the subject. Now, you may be thinking, “This is all well and good, but how is this going to become ‘anything’?” The cool thing is that this tool does it! It records each (x,y) coordinate and when the ‘object’ is defined by connecting the points it also generates an object ID.
You can easily copy and paste this data into a workable format in order to import the file into Tableau. I personally opened up Notepad and pasted the contents into a new file and saved it as as [Title].csv — the (.csv) format allows an easy connection to Tableau!
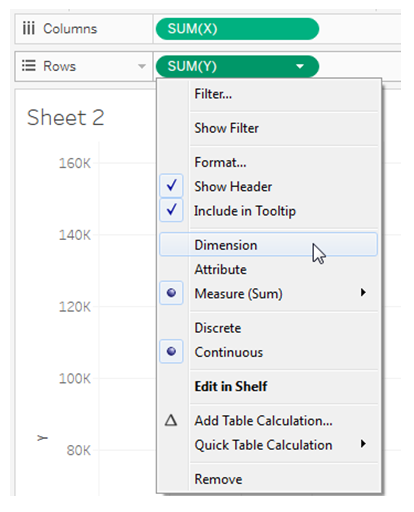
Let’s build the Viz! First, we want to bring the [X] and [Y] measures on the proper shelves. Then, we want to change them into ‘Dimensions’ in order to create the actual numbers of where the (x,y) are located rather than an aggregation on measures Tableau ‘thinks’ it has too.
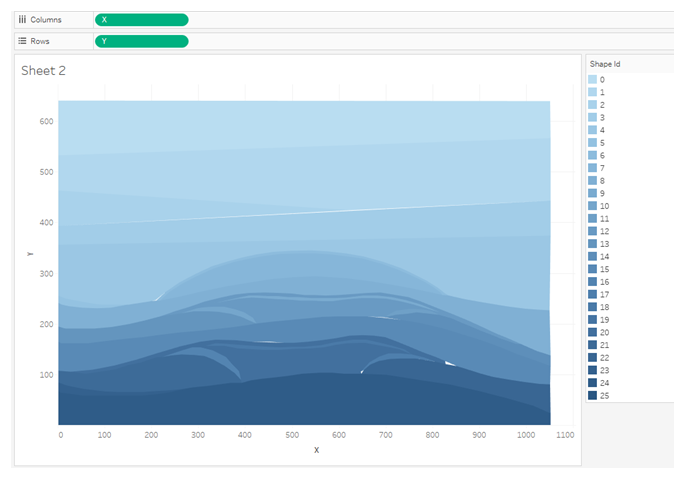
After making [X] and [Y] ‘Dimensions’, your sheet should start looking like this:
 Alright, now we can start to see what we are looking to achieve!! But, “How do we create that beautiful wave art?” Well, we have to create a path and set the colors for specific ‘objects’. The next step is to change the mark type to polygon and set the [Point Id] field as the path and set the [Shape Id] as the color. And you should have this…! (colors may differ)
 In order to determine what ‘Object’ is what and what color should be assigned to each polygon you can easily hover over with your mouse to find the [Shape Id] and just take note!
 Time to color!! Now we get the custom color selection tool open found within Tableau to collect our color palette.

In my example, there are 26 individual polygons and below you can see each one of their colors. These colors were taken directly from the subject we found online in the beginning of this tutorial. 
In the end, you should end up with something like this!

Click here for the interactive version!
Congratulations!! You just created Polygon art in Tableau!
Surf On and Keep Vizzin’!
The Data Surfers.
